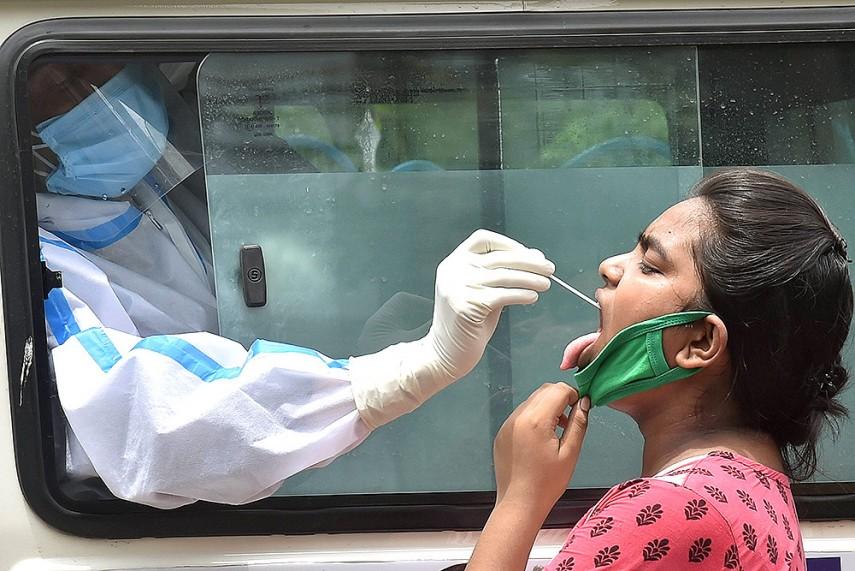
COVID-19: Why have States Across the Country Stopped Testing!?

Image Courtesy: Outlook India
Ever since the COVID-19 pandemic struck the globe, the one message that the World Health Organisation (WHO) has been stressing on is ‘Test, Test, Test!’ However, it can be seen that testing for the virus picked up quite late, and is differing across states.
In the initial phase, testing was limited due to the scarce availability of testing kits. Gradually, as kits were imported and locally developed, the numbers gradually picked up – only after July. However, over the past few weeks, there has been a decline in the number of tests across many states; though the number of cases has also seen a decline. The decline in the number of tests is cause for concern since the pandemic has been erratic. There are already signs of a resurgence in cases in different regions – such as Delhi – the country cannot afford to lower its guard until a vaccine is developed to combat the novel coronavirus.
Here, we analyse the positivity rate and try to understand the extent of transmission in the community – the rate being defined as the total number of confirmed cases to the total number of tests. The positivity rate helps ascertain how adequately the testing is while also aiding our understanding of the spread of the virus, when looked at in conjunction with the number of confirmed cases.
The positivity ratio will be high in two scenarios – either if the number of emerging cases is too high, or when the number of total tests is too low. A higher positivity ratio may suggest that there may be more people with the virus in the community who have not been tested yet. However, amid reports of data manipulation, there is a need for caution while using each indicator before arriving at conclusions.
According to criterion put forth by the WHO in May, a positivity rate of less than five per cent for 14 days is one indicator that the epidemic is under control in a country. The positivity rate for India at present (for the week October 23-29) stands at about 4.3 per cent. The rate had peaked in the second half of July, reaching 12.1% (July 17-23). The following figure tracks the trajectory of the positivity rate for India since May.
However, the steady, though marginal, decline after a peak may not necessarily imply that the COVID-19 situation is improving in India. Given reports that there has been massive under-reporting across states, we need to interpret the positivity rate cautiously. Moreover, the nature of the pandemic is such that it is difficult to predict its course and it may take any direction – upward or downward – at any stage.
There has been a lot of variability in the positivity rate across states in India. While some states like Delhi have recorded a positivity rate of up to 36% when the pandemic was at its peak in the week between July 10 and July 16, other states like Bihar have a positivity rate of about one per cent at the moment. The table below shows the two categories of select states at extreme ends of positivity ratio figures (for the week between October 23 and October 29)
Trends in tests and cases across six states with a low positivity ratio
As of now, the states of Bihar, Jharkhand and Uttar Pradesh have the lowest positivity ratios of one per cent. The trio is followed by Gujarat and Punjab (two per cent) and Uttarakhand (three per cent). The numbers are well below the WHO ballpark figure for gauging if the epidemic is under control. Since the second half of July, the positivity ratio in these six states has been declining – though it was only after mid-September that it declined in Punjab – in Bihar and Gujarat the positivity rate has stayed low and stable since September. Uttarakhand, however, experienced a spurt in mid-September, recording a figure as high as 12%. The figure below shows the trend of positivity ratios in these six states in the week between October 23 and October 29.
In Punjab, this decline can be seen due to a drop in the number of cases with the number of tests largely remaining at the same level, with some intermittent fluctuations. In Bihar, the low positivity could have resulted due to a decline in the number of cases since mid-August; the number of tests declined in the last week of September. The rate of decrease in the number of cases has been higher than the rate of decrease in tests for positivity ratio to decline, though testing has picked up in Bihar again over the past two weeks, keeping the ratio as low as one per cent. However, with election season in Bihar and almost a complete disregard of advised precautions being seen, it will not be a surprise if the pandemic spreads its tentacles in the region once again.
In Gujarat, however, tests have been declining since the last week of September, so are the number of cases. From about the same week we see a stabilisation of the positivity rate at about two per cent. In UP, testing increased all through, though it has dropped since mid-October. The number of cases has been declining since the second week of September, bringing the positivity ratio down. This could be because UP ramped up testing by deploying Rapid Antigen Tests (RAT) along with other tests such as TrueNat and CBNAAT.
A declining positivity ratio along with a decrease in testing implies that the number of confirmed cases in the state is dropping at a comparatively faster rate, offsetting the decline in testing. This presents a rather peculiar situation and warrants an enquiry since obtaining a low positivity ratio with a fast decline in the number of cases alongside a decline in testing could indicate data manipulation. Ground reports have already hinted at gross under reporting of COVID-19 cases and deaths.
Trends in testing and cases across six states with a high positivity ratio –
Among states with the highest positivity rates at present, Kerala has seen a resurgence of COVID-19. Maintaining a rate below five per cent until about July, the state assured that the pandemic was under control. However, it made a comeback in Kerala with the rate at 16% percent in the second week of October. Until then, Kerala had been following the advice of ‘more testing’, thus detecting a greater number of cases. However, with testing showing a downward trend, the number of cases has also decreased in the second half of October. In Chhattisgarh, testing began dropping off only in the second half of October while the number of cases had been declining since the beginning of the month.
Among the top six states with the highest positivity rate, recent data shows that states like Delhi and West Bengal show a rising trend, indicating a resurgence. In West Bengal, the number of confirmed cases has been rising almost throughout, while the number of tests declined since mid-September. Over the past few weeks however, testing has increased again in West Bengal. In Delhi too, the number of cases has seen a rise, thus increasing the positivity rate.
Notably, the trend across most states in India has been of low testing, thus resulting in a lower number of cases being detected. This is apparent from Figure 4 below, where most of the states are seen in the low tests-low cases quadrant. Most states are not testing enough and are still unable to detect cases as a result.
There is a clear a need to increase testing across states in India. The decline observed in the number of tests could be a sign of complacency setting in. Most of the lockdown restrictions have been done away with.
The unpredictable nature of the pandemic, as seen in France and Spain – where it returned after showing signs of ebbing – or even closer to home as seen in Delhi and Kerala, India needs to test more, lest it is caught off-guard and has to pay a heavier price with many more fatalities.
Richa Chintan is associated with the Jan Swasthya Abhiyan and the People’s Health Movement.
Get the latest reports & analysis with people's perspective on Protests, movements & deep analytical videos, discussions of the current affairs in your Telegram app. Subscribe to NewsClick's Telegram channel & get Real-Time updates on stories, as they get published on our website.


