Trump Vs Biden: Big Businesses Pump in Big Money in Costliest Ever US Election

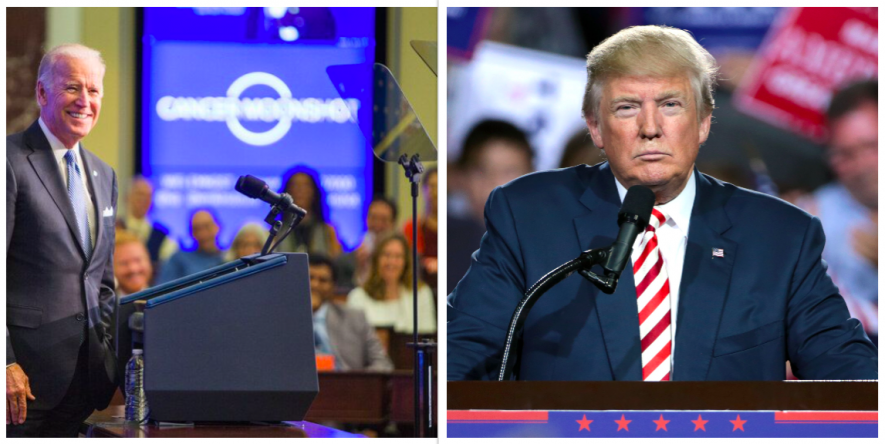
The ongoing election campaign in the United States, dominated by the bitter war between US President Donald Trump and Democratic challenger Joe Biden, is turning out to be the costliest ever, in inflation adjusted terms. Besides this, elections to the Senate and the House of Representatives are also taking place. When put together, the spending for deciding on this triumvirate that rules the US is mind blowing. Partly this is because public activity is restricted somewhat due to the raging pandemic. But mainly it’s driven by a deep fracture in the US society, and in its ruling elite, on how the country should be run in the coming years after four years of Trump’s divisive and brazenly elitist rule.
Biden has already spent $938 million while Trump has spent $596 million, according to federal election filings till October 26, analysed by the Washington based advocacy group Center for Responsive Politics (CRP). There is still a week to go before the November 3 elections and the final spending figures will be available only after that. Not included in this is “outside spending” and “dark money” by corporations and big donors that spend independently in support of a particular candidate. Since a Supreme Court ruling in 2010, they are no longer required to submit accounts, as long as they don’t coordinate with the official campaigns.
For the presidential campaign, $2.16 billion was spent by all the other Democratic aspirants who dropped out or lost in the primaries. Adding that to the spending of the final two candidates gives an expenditure of $3.69 billion – a record. [See chart below]
The House and Senate races are also guzzling money in a big way. According to CRP’s collated data, $1.7 billion has been spent on the 435-member House elections while $1.5 billion has been consumed in the 100-member Senate elections. As with the presidential candidates, Democrats are outspending Republicans in both House and Senate races.
Adding these expenditure numbers to those for the presidential contest, about $6.9 billion has been spent in these federal elections. The CRP estimates that by the end of it, the current election cycle would have consumed some $11 billion, which is way more than any other US election cycle even after adjusting for inflation. For example, the 2016 election (Trump vs Hillary Clinton) saw $7 billion spent while the 2012 election (Obama vs Mitt Romney) consumed $7.1 billion in inflation adjusted dollars.
Where is the Money Coming From?
Besides the estimated $1 billion “outside money” that has flowed into the campaign (on both sides), CRP has analysed the industry/sectors that have given big donations to Trump or Biden [See chart below showing some of the big donors]. These are part of statutory federal filings by respective campaigns. Biden has received funds mainly from Finance/ Insurance/ Real Estate, and Communication/Electronics industries, and also from lawyers and lobbyists. Trump on the other hand has benefited from Health, Energy and Natural Resources, Construction, Agribusiness and Transportation industries. Note that all these industries and sectors donate to both sides.
Other relatively smaller donations spanning a wide range of sectors/industries have contributed over $272 million in all, divided between Trump ($155 million) and Biden ($117 million). Large donations make up 61% of Biden’s official war chest. That’s about $581 million of the total. For Trump such large donations constitute 55% or $326 million.
As the table above makes clear, both sides are being backed by big business along traditional lines of division. New economy businesses (like the tech sector and the financial sector behemoths) prefer Biden, while most other sectors are behind Trump.
Record Spending on TV/Online Ads
According to data analysed by Wesleyan Media Project, TV and online advertising is also in record breaking territory this year. About 4.5 million ads have been telecast till October 11, involving spending of about $2.5 billion. Of these, nearly 2 million of the airings have occurred in the presidential race alone (an increase of 147% over 2016) at an estimated cost of $1.3 billion while the remaining are for House and Senate races.
On digital, presidential candidates, their leadership PACs and single-candidate Super PACs have spent an additional $615 million on Facebook and Google since January 2019.
This of course is the picture from the official donations that are recorded and go into election filings. A considerable amount, much larger than this, flows secretively into Super-PACs (Political Action Committees) that are groups for fund mobilisation and which deploy the money mostly for TV and online advertisements, and hosting fund raisers, etc.
On November 3, the world will know whether Trump will continue or get replaced by Biden. But a thought needs to be given at how democratic is the electoral process that involves this kind of spending even when the whole world is reeling under recession
Get the latest reports & analysis with people's perspective on Protests, movements & deep analytical videos, discussions of the current affairs in your Telegram app. Subscribe to NewsClick's Telegram channel & get Real-Time updates on stories, as they get published on our website.


