Govt Spin Hides India’s Real Poverty
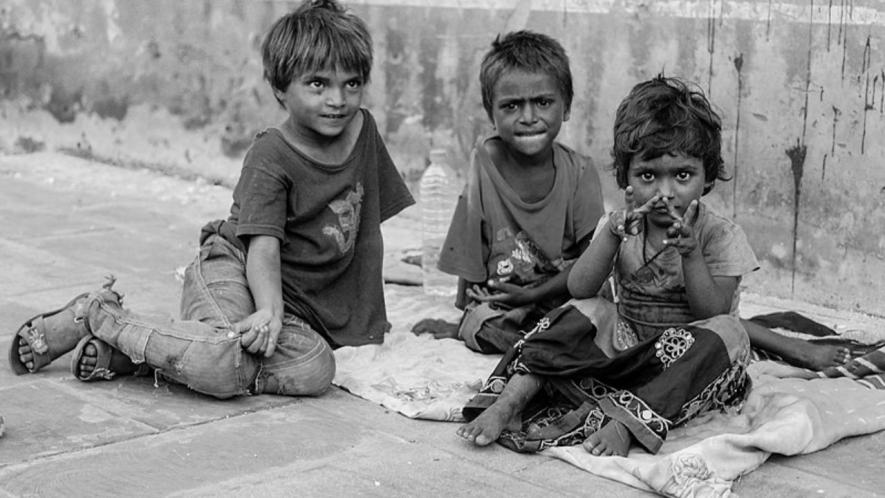
Representational Image. Image Courtesy: Wikimedia Commons
The other day the chief executive officer of NITI Aayog made a fantastic claim, that the poverty ratio in India had fallen below 5% according to the 2022-23 consumption expenditure survey data. His claim was based on the fact that the per capita consumption expenditures of only 5% of the population in 2022-23 fell below the poverty-lines for that year for rural and urban India, arrived at by updating, on the basis of consumer price indices, the poverty-lines suggested for 2011-12 by a committee headed by Suresh Tendulkar.
Now, the Tendulkar Committee had not based its 2011-12 poverty lines on any objective criteria, such as minimum calorie intake, or the price of a minimum necessary basket of goods; it had simply made some arbitrary decisions regarding what these lines should be.
Besides, the consumer price indices being used for updating these Tendulkar poverty lines have serious under-estimation biases as they do not take adequate account of the privatisation of essential services like education and healthcare.
Moreover, the consumption expenditure survey for 2022-23, has been conducted on different lines from all earlier surveys, because of which its results are not comparable with earlier results, and its biases are not yet fully known because the complete data have not been released.
The 5% mentioned by the NITI Aayog, therefore, has little sanctity. What is more, it flies in the face of a mass of other information that we have about the economy, because of which the conclusion is inescapable that this figure is being pushed by the government for propaganda purposes before the elections. Let us see what this other information is.
The findings of the 2017-18 consumption expenditure survey were utterly abysmal, so abysmal that they were withdrawn by the government. But from whatever was leaked out, it could be calculated that the proportion of persons in urban India who could not access 2,100 calories per person per day, the original Planning Commission benchmark for urban poverty, was as high as 60%, which was higher than 57% for 1993-94 though lower than 65% for 2011-12.
For rural India, however, the proportion that could not access 2,200 calories per person per day, the corresponding benchmark, was well over 80%, compared to 58% in 1993-94 and 68% in 2011-12.
Taking the two together, clearly the true poverty ratio in 2017-18 was significantly higher than in 2011-12 given the much higher weight of rural India in the total. (These figures are from Utsa Patnaik’s forthcoming book).
Poverty, in short, had increased significantly between 2011-12 and 2017-18. After 2017-18, we have had a pandemic, and a lockdown induced by it, from which the economy is just recovering, though unemployment today is higher than before the pandemic.
The claim that the poverty ratio has come down compared with 2011-12, whence it would follow that it has come down even more sharply compared with 2017-18, precisely in a period when the economy was racked by a pandemic, defies credibility.
Of course, it would be argued that calorie intake cannot be an indicator of poverty. But this argument is based on a misunderstanding. The point is not that calorie intake alone should count for estimating poverty; the point is that whenever there is an increase in real income, it necessarily also shows itself in terms of an increase in calorie intake.
In other words, the proposition that there could be a reduction in calorie intake even when a person becomes better off, at levels of intake that one finds in countries like ours, is wholly untenable; if it occurs then that must be treated as a worsening of real income. And empirical evidence fully supports this proposition that there is a clear positive relationship between per capita income and per capita cereal consumption (which also means per capita calorie intake).
Since there is no data on incomes whatsoever, and since consumption expenditure data which are available can be meaningfully compared across time only by using some price index, but all such indices are unreliable, taking calorie intake as a proxy for real income and comparing such intake over time makes perfect sense. And if we do so, then until 2017-18, the poverty ratio in the country has increased, and after that we simply do not know. If the government makes available the calorie intake information contained in the consumption survey for 2022-23, which it has not yet done, then we shall know for sure what has been happening to poverty.
Until then, however, we can only fall back on stray indirect evidence, and virtually all such evidence points not just to the existence of substantial poverty in the country but even to an increase rather than a decrease in the poverty ratio.
The first such indirect evidence is from the National Family Health Survey. The NFHS-5, covering 2019-21 shows that the incidence of anaemia among women in the age-group 15-49 has increased compared with NFHS-4 that covered 2015-16, with 57% being anaemic on the later date compared to 53% earlier. The number of states where more than half the women were anaemic was 25 in 2019-21 compared with 21 in 2015-16.
It is often argued that the incidence of anaemia among Indian women is overstated because the same criteria which are used in the west are also applied in India, which is incorrect. But this argument, even if one accepts it for a particular point of time, does not apply to comparisons over time; the worsening in this respect over time therefore is quite indubitable.
The second bit of indirect evidence comes from the global hunger index (GHI). In 2023, India occupied the 111th position among the 125 countries for whom the GHI is calculated. The government of India has objected to the index stating that it is a flawed measure. But no matter whether one agrees with the variables that are included in the hunger index and the weights given to these variables, a country that witnesses a significant increase in the per capita real income even for the bottom deciles of the population, which alone can explain the claimed sharp decline in poverty, should certainly be seeing an improvement in its position in the hunger index.
But that is not all. On most of the variables included in the computation of the hunger index, namely population undernourishment, child wasting, child stunting, and child mortality, the situation in 2023 was distinctly worse than in 2008; the only exception was in undernourishment where it was roughly the same but distinctly worse than in 2000.
True, those who prepare the hunger index warn that scores across time should not be compared, strictly speaking, because of changes in data source. Nonetheless, the fact that there has been a worsening in all indicators that go into the hunger index compared to 2008 or 2000 (for undernourishment) clearly suggests that the claimed improvement in the real incomes of the bottom deciles of the population (which alone would explain the sharp decline in poverty) has no basis.
The third bit of indirect evidence comes from the so-called “zero food children”, that is children between 6 and 23 months who have not had any food other than breast milk in the previous 24 hours. “Zero food”, of course, gives the impression that such children have had no food at all which is incorrect; what it actually means is that they have had no supplementary food apart from breast milk in the previous 24 hours. And there were 6.7 million such children in India in 2023.
The fact that this is a deprivation is undeniable; and even though the reason may not always have to do with the absence of purchasing power with the family, it certainly is linked to parents having to work long hours for their livelihood, which is just another manifestation of poverty. The percentage of such children within the total number of children in the relevant age-group comes to 19.3% in India, the third highest among all the countries of the world, after Guinea (21.8%) and Mali (20.5%). This again suggests that the claimed increase in real income in bottom deciles which is supposed to have banished poverty from the land is completely unfounded.
No matter what spin the government gives on poverty, the world knows that India is a desperately poor country. A recent UN report has found that as much as 74% of India’s population cannot afford the minimum nutritious diet that is prescribed by the Food and Agriculture Organisation or FAO for South Asia; this is a shocking fact.
Get the latest reports & analysis with people's perspective on Protests, movements & deep analytical videos, discussions of the current affairs in your Telegram app. Subscribe to NewsClick's Telegram channel & get Real-Time updates on stories, as they get published on our website.


